The ‘pop-in’ detection
The pop-in detection in the literature
In 2001, Malzbender J. et al. proposed to use the derivative \(dF/dh^{2}\) vs. \(h^{2}\) of the indentation load-displacement data for the pop-in detection [3]. Minima on these curves correspond to pop-in on the load-displacement curve.
In 2004, Juliano T. et al. proposed to extract numerically the derivative behavior from the loading and unloading portions of the load-displacement curves [2]. The numerical first derivative at a depth \(h_\text{x}\) was taken to be the slope of the least-squares fit between load-displacement data points and given as:
(19)¶\[{\left(\frac{dF}{dh}\right)}_{\text{h}_\text{x}} = \frac{y\left(\sum_{F_{\text{x-(y-1)/2}},h_{\text{x-(y-1)/2}}}^{F_{\text{x+(y-1)/2}},h_{\text{x+(y-1)/2}}}{Fh}\right)-\left(\sum_{h_{\text{x-(y-1)/2}}}^{h_{\text{x+(y-1)/2}}}{h}\right)-\left(\sum_{F_{\text{x-(y-1)/2}}}^{F_{\text{x+(y-1)/2}}}{F}\right)}{y\left(\sum_{h_{\text{x-(y-1)/2}}}^{h_{\text{x+(y-1)/2}}}{h^2}\right)-\left(\sum_{h_{\text{x-(y-1)/2}}}^{h_{\text{x+(y-1)/2}}}{h}\right)}\]
with \(x\) the data points number and \(y\) a positive odd integer number of data points considered.
Juliano T. et al. proposed also to take the derivative at a depth \(h_\text{x}\):
(20)¶\[{\left(\frac{dF}{dh}\right)}_{\text{h}_\text{x}} = \frac{F_{\text{x+(y-1)/2}}-F_{\text{x-(y-1)/2}}}{h_{\text{x+(y-1)/2}}-h_{\text{x-(y-1)/2}}}\]
In 2014, Askari H. et al. developed the following criteria in his algorithm, to detect a pop-in [1]:
Absolute change in depth over 2 lines of data: \(\Delta h = h(i) - h(i-1)\)
Forward 2 pts avg - trailing 2 pts average: \(\Delta h = (h(i)+h(i+1))/2 - (h(i-1)+h(i-2))/2\)
Forward 3 pts avg - trailing 3 pts average: \(\Delta h = (h(i)+h(i+1)+h(i+2))/3 - (h(i-1)+h(i-2)+h(i-3))/3\)
The absolute step size is the difference beteen two (or more in case averaging is active) consecutive depth readings from the machine. If this step size exceeds a user defined number then it is considered as pop-in.
In her PhD thesis, G. Nayyeri proposed to use the the first derivative at a depth \(h = h_0\) of the load-dispalcement curve, to detect a pop-in [4]:
(21)¶\[{\left(\frac{dF}{dh}\right)}_{\text{h}_{0}} = {F_{{\text{h}_{0}}+\Delta \text{h}} - F_{\text{h}_{0}} \over \Delta h}\]
The pop-in detection in the PopIn Matlab toolbox
In the PopIn Matlab toolbox, numerous criteria based on the function diff, are implemented to detect pop-in on the load-displacement curve:
Criterion 1 - Differences between adjacent depths: \(\Delta h = diff(h) = h(i+1) - h(i)\)
Criterion 2 - 2nd differences between adjacent elements (the diff operator is used 2 times): \(\Delta h = diff(diff(h)) = diff(h,2)\)
Criterion 3 - 3rd differences between adjacent elements (the diff operator is used 3 times): \(\Delta h = diff(diff(diff(h))) = diff(h,3)\)
Criterion 4 - 1st derivative of the load-displacement curve: \(1/(dF/dh) = 1/(diff(F)/diff(h))\)
Criterion 5 - 2nd derivative of the load-displacement curve: \(-1/(d^{2}F/dh^{2}) = -1/(diff(dF/dh)/diff(h))\)
Criterion 6 - Derivative of the load-displacement curve: \((dF/dh^{2}) = ((diff(F)/diff(h))/diff(h))\)
The 6th criterion is based on the one proposed by Malzbender et al. [3]. Malzbender proposed to plot the 6th criterion as a function of \(h^{2}\) and not as a function of \(h\), like it is proposed in the PopIn toolbox.
When a pop-in occurs, a peak is observed on the plot of differences or derivatives. Peaks anaysis is performed using the function peakdet released by E. Billauer to the public domain (http://www.billauer.co.il/peakdet.html). Only positive peaks are counted. A point is considered a maximum peak if it has the maximal value, and was preceded (to the left) by a value lower by a given delta. The delta value can be set by user from the GUI.
Plots of the different criteria normalized by its maximum as a function of normalized indentation displacement (\(h/max(h)\)).
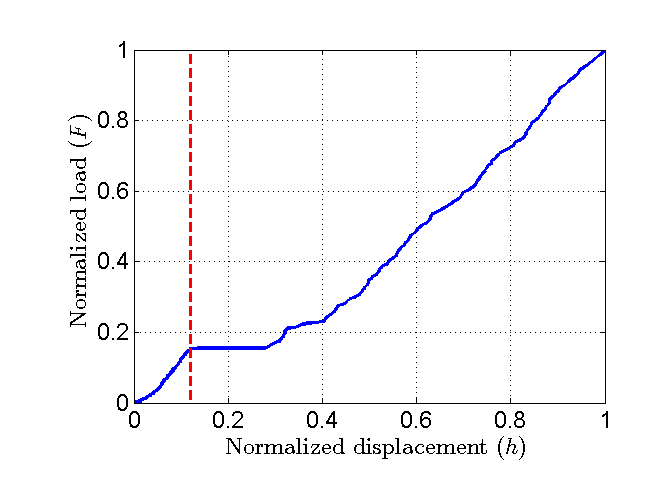
Figure 15 Plot of an experimental load-displacement curve displaying a pop-in.
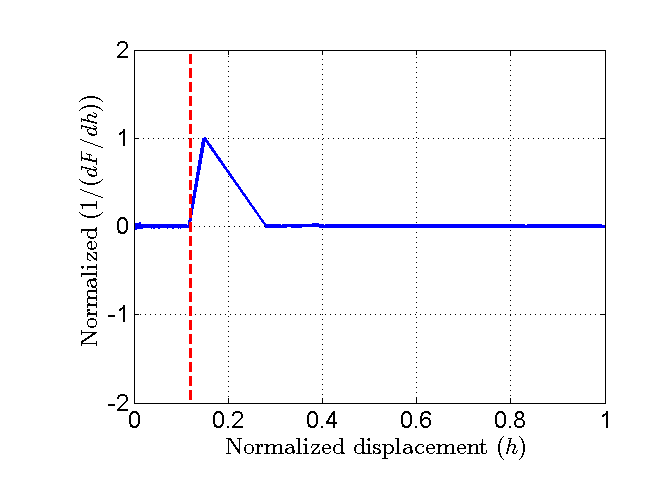
Figure 16 Plot of the normalized 1st criterion.
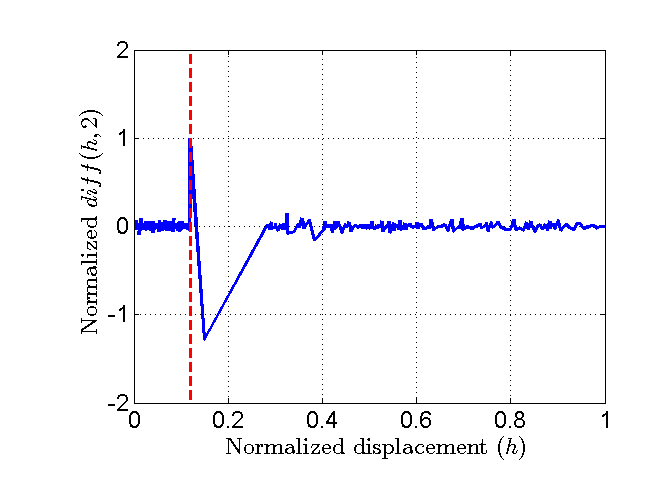
Figure 17 Plot of the normalized 2nd criterion.
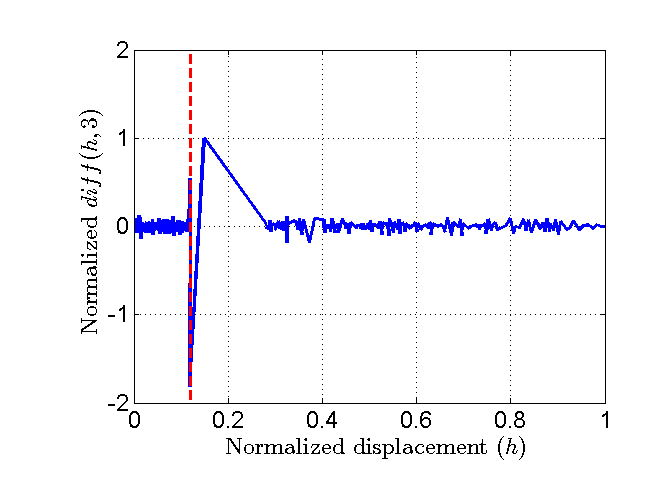
Figure 18 Plot of the normalized 3rd criterion.
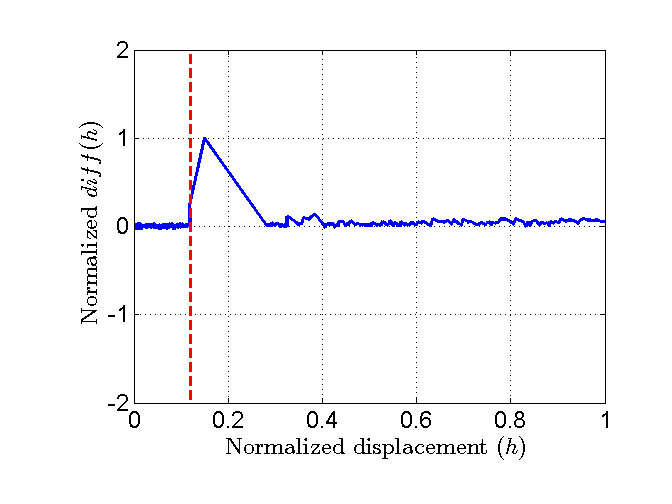
Figure 19 Plot of the normalized 4th criterion.
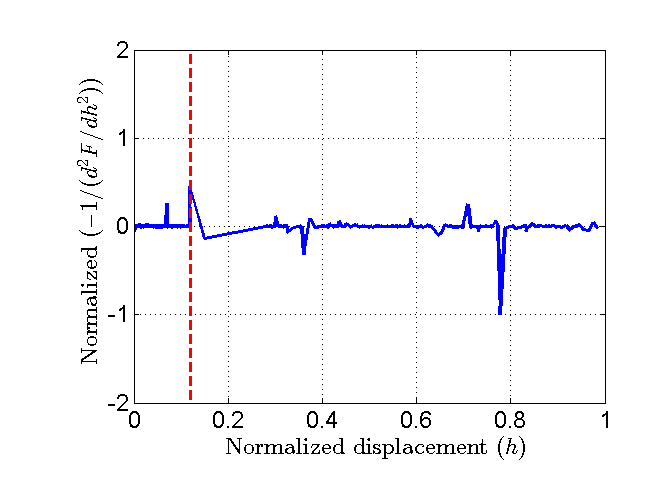
Figure 20 Plot of the normalized 5th criterion.
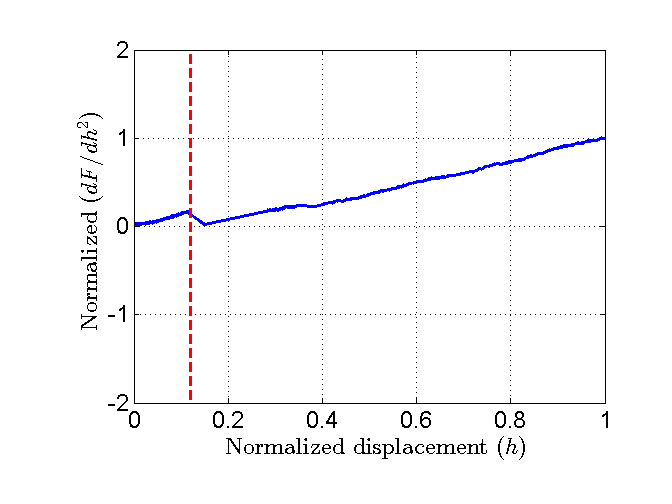
Figure 21 Plot of the normalized 6th criterion.