PopIn Matlab toolbox
This toolbox has been developed to plot (nano)indentation data and to analyze pop-in events distribution.
With this Matlab toolbox, it is possible to:
- plot load-displacement curves ;
- fit the load-displacement curves with Hertz model ;
- plot cumulative (Weibull or time/temperature dependent) distribution of the 1st or the 2nd pop-in.
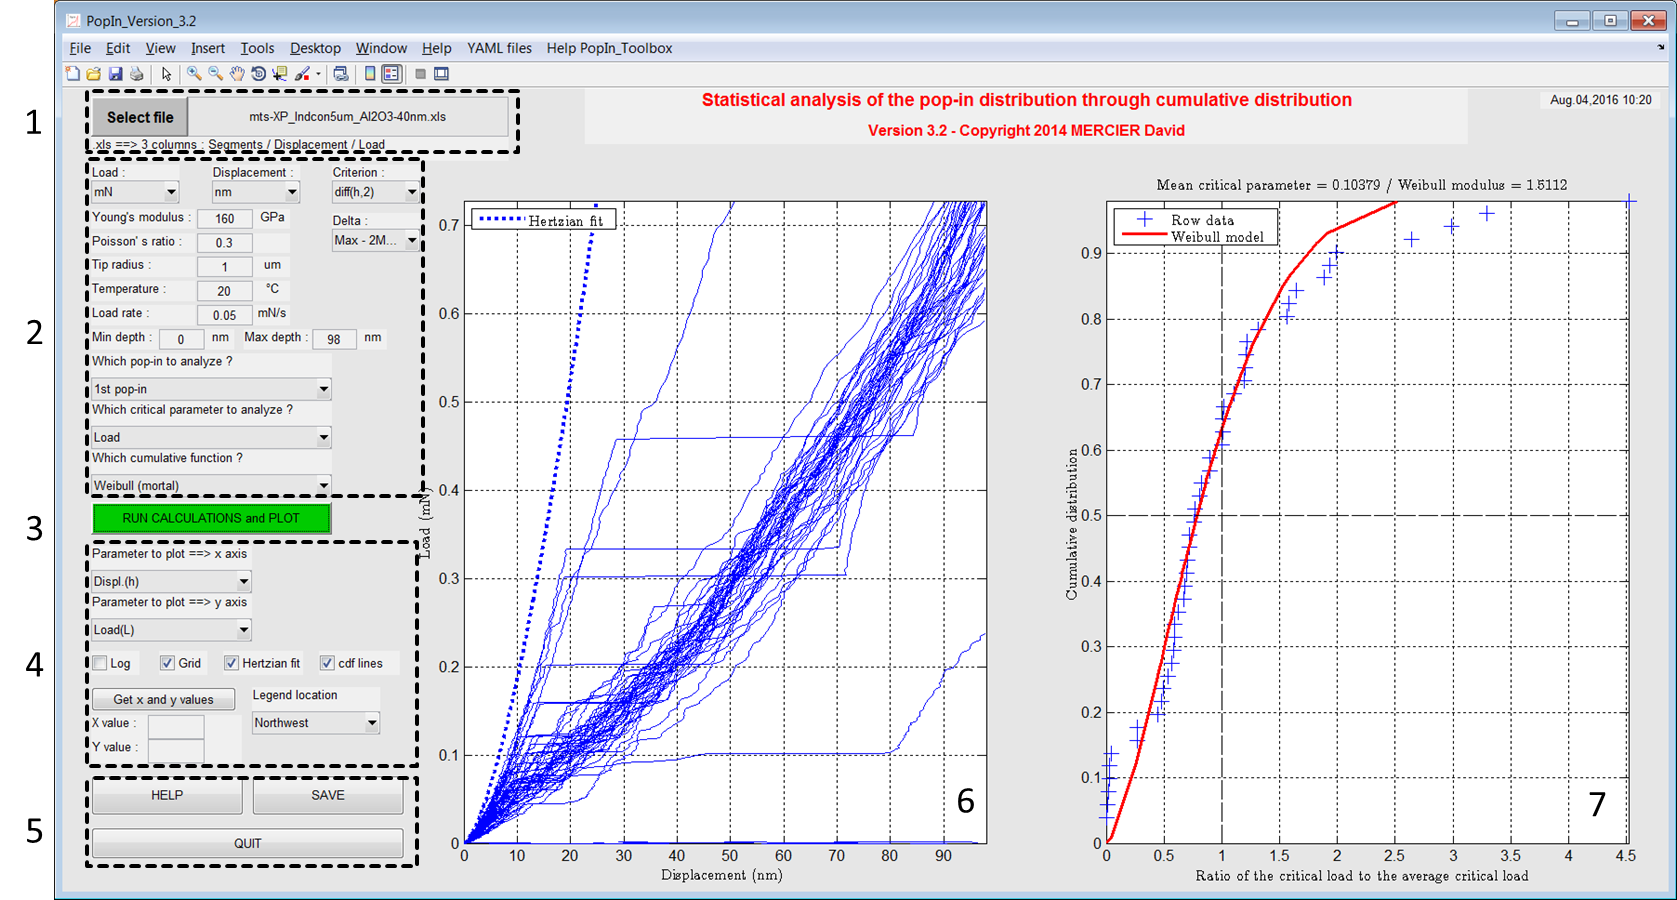
Figure 1 Screenshot of the main window of the PopIn toolbox.
Contents
Contact
| Author: | David Mercier [1,2,3] |
|---|
[1] CEA, 17 Avenue des Martyrs, 38000 Grenoble, France
[2] Max-Planck-Institut für Eisenforschung, 40237 Düsseldorf, Germany
[3] CRM Group, Avenue du Bois Saint-Jean 21, B27 – Quartier Polytech 4, 4000 Liège, Belgium
Keywords
Matlab toolbox ; Graphical User Interface (GUI) ; nanoindentation ; pop-in ; cumulative distribution ; Weibull ; statistics ; load-displacement curve ; survival probability ; critical load ; critical displacement ; Hertz model.