Overview of the toolbox
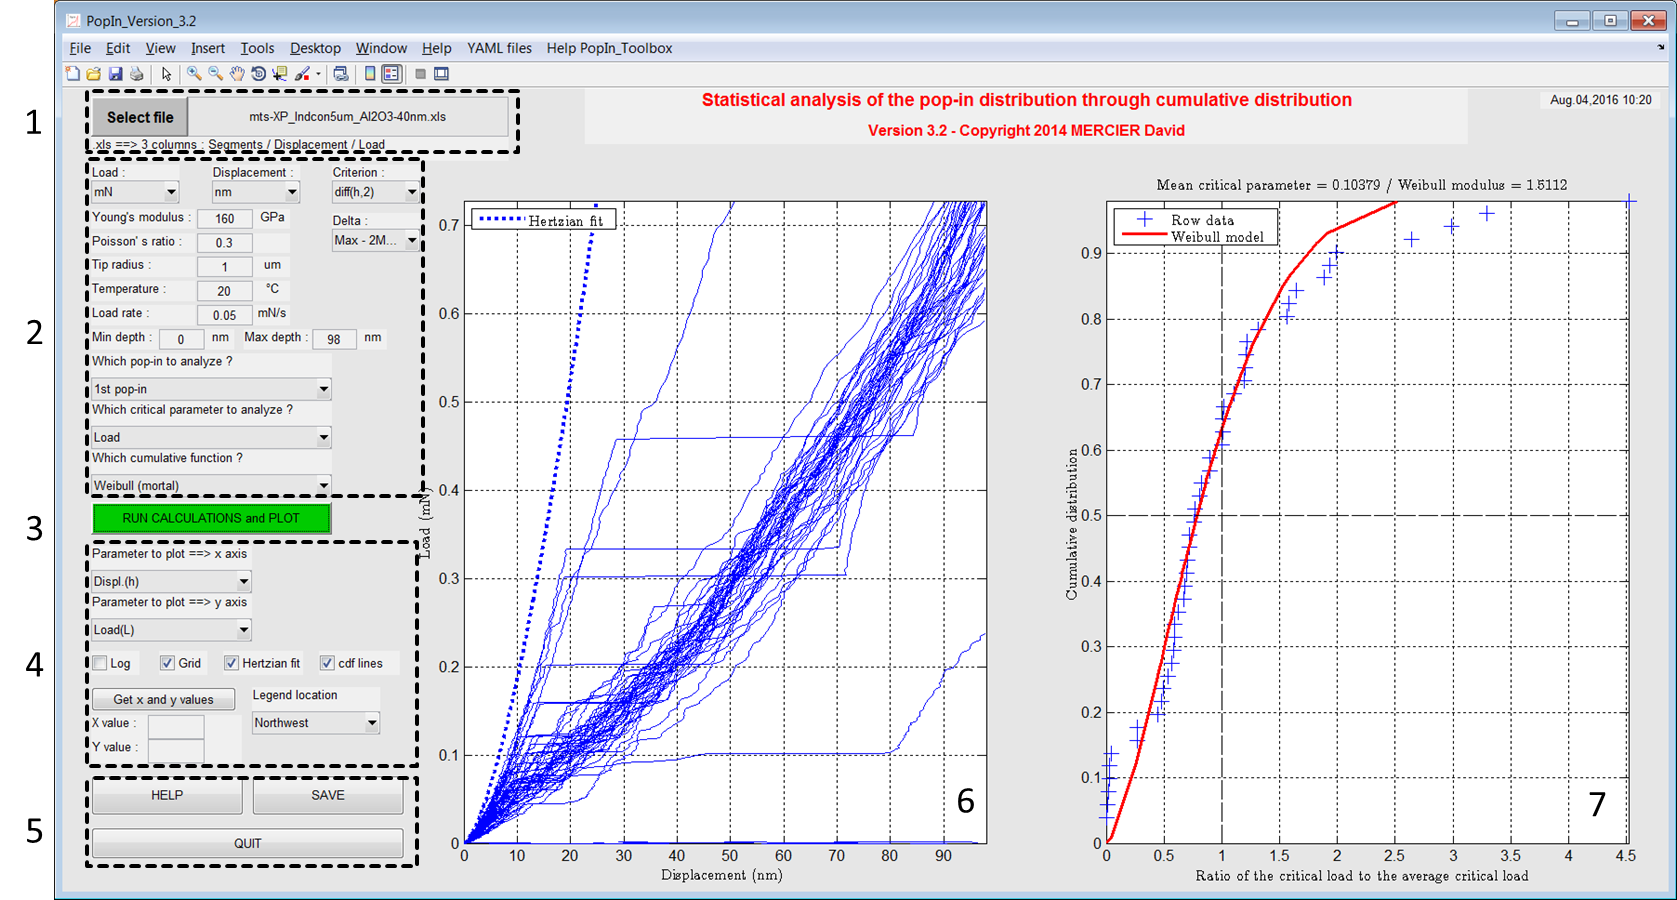
- Import your (nano)indentation results. See here an example file.
- Set units, set the criterion of pop-in detection, set temperature of experiments, set the minimum and maximum indentation depths, set the pop-in to analyze and select the critical parameter to use for the Weibull distribution.
- Run the calculations and plot results.
- Set the plots.
- Save a picture of the main interface or quit this interface.
- Load-displacement curves with pop-in and Hertzian fit.
- Cumulative distribution of the pop-in.
Note
It is possible to modify YAML configuration files directly from the menu of this interface.
Note
Documentation is reachable from the button ‘HELP’ or the menu.